
The management reports generated by the IT team seek to contextualize the company on the management of the team and the use of technology products by our customers, thus providing tools to understand the status of applications inside and outside Alto.
In order for the company to know the status of the IT team management and the use of the products, different reports were designed and shared periodically.
Dashboard TI
This report is sent weekly, via e-mail, and includes a summary of the team’s management of a specific product (currently only applies to Alliance, in definition the other products), it is divided as follows:
- Technological Infrastructure
- 1.1 Downtime: Time that the servers or products have been out of operation in the last 7 days.
- 1.2 Service downtime detail: Detail of the server or product downtime.
- 1.3 Server expenses: Trend of the difference in the budget vs. the execution of the money destined to the maintenance and operation of the server.
- Usability
- 2.1 Events: Number of events reported
- 2.2 % Non-traditional: Percentage of non-traditional events reported.
- 2.3 % APP: Percentage of events reported through the App (Mobile)
- 2.4 % Usability of stores: % of stores that report at least one event out of the total number of active stores.
- 2.5 Active Accounts: Number of active accounts in the system.
- 2.6 Active Stores: Number of active stores in the system
- Information Quality
- 3.1 Quality Index (QI): Index that shows the quality of the reported data. It is composed of the report of open fields (multiple choice) and closed fields (written descriptions) filled in by clients in the form. For each field, general and variable-specific alerts are evaluated. Among the alerts are: very high %missing, all variable values the same, outliers, the same value very repeated, among others). Subsequently, a categorization of the number of alerts by events, accounts and stores is performed (these categories are: Well, Medium Well, Medium, Almost Poorly, Poorly and Missing). Expertly defined weightings are then assigned to each category. Thus, the % of information quality is calculated as the multiplication of the weights against the % of events, accounts or stores that fall into each category mentioned. Finally, this multiplication is transformed to be between 0 and 100%.
- 3.2 Development: Represents how well the reports answer the questions associated with an event (“what” happened in the event, “who” stole it or witnessed it, “why” the incident happened, “how” the theft took place, “when” the event took place, “where” it took place, “how much” the loss associated with the event was). It is calculated based on the number of alerted events (with missing or invalid values) / number of event fields analyzed question type.
- IT Operation
- 4.1 Development
- 4.1.1 Fulfillment (Plan.): Measures the percentage of original tickets that were solved. It is calculated as number of tickets originally requested / number of tickets committed.
- 4.1.2 Fulfillment (Total): Measures the number of tickets resolved. It is calculated as the number of tickets delivered / number of tickets requested.
- 4.1.3 Capacity: Measures the occupancy of the team. It is calculated from the effort captured over expected effort by multiplying working days by 8 hours.
- 4.2 Current developments: Tasks or developments being carried out %Completion (Plan.): Measures the percentage of original tickets that were solved. It is calculated as number of tickets originally requested / number of tickets committed.
- 4.3 SLA Help desk:
- 4.3.1 Response: Measures the first response time for help desk requests. It is calculated as number of tickets answered in the first 4 hours / number of tickets received.
- 4.3.2 Solution: Measures the time in which help desk requests are solved. It is calculated as number of tickets solved in the first 8 hours / number of tickets received.
- 4.3.3 Satisfaction: Measures the satisfaction of internal customers with the performance of the help desk area. It is calculated based on a rating from 1 to 5 provided by the internal customer 100%.
- 4.4 SLA Implementations:
- 4.4.1 Response: Measures the first response time of requirements in implementations. It is calculated as number of tickets answered in the first 4 hours / number of tickets received.
- 4.4.2 Solution: Measures the time in which requirements are solved in implementations. It is calculated as number of tickets solved in the first 8 hours / number of tickets received.
- 4.3 Satisfaction: Measures the satisfaction of internal customers with the performance of the implementation area. It is calculated based on a rating from 1 to 5 provided by the internal customer.
- 4.5 Time distribution: Distribution of time throughout the tasks performed in the area.
- 4.1 Development
Product overview
This report is available in Monday, showing the status of the requirements, week by week, in the different products, countries and/or customers. Focusing on the total number of requirements and their status. It can be consulted in the following links:
- Alliance
- MovUp
- Checks
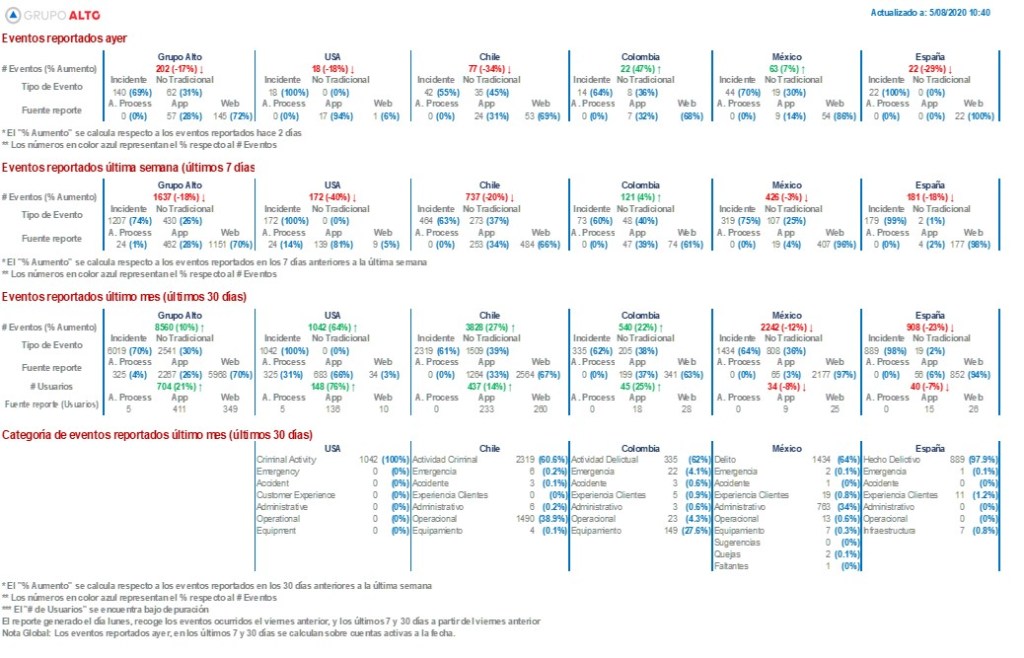
Usability
A daily report of the use of the application is sent by mail (currently only applies to Alliance, in definition the other products), here is an example of the summary, also a detailed excel is sent:
Expenses and budget
This report shows in detail the IT spending, at the level of infrastructure, technological tools and collaborators. This report is seen in the IT finance committee and is confidential information.
Data sheets
Daily the IT team sends an email with an Excel file called “Data Savannah” which is available on the drive about the following:
- Legal
- Hearings
- Events
- Defendants
- Products
- Task Manager
- Users
- Discovery
- Accounts
- Stores
Inventory
An inventory of the reports delivered, both management and product reports, is kept.
See more This information is in Spanish, if you require translation you must submit the request at the following link: https://soporte-ti.atlassian.net/servicedesk/customer/portal/14/group/83/create/868
CLASSIFICATION: INTERNAL USE
Any printing or digital copy of the document is invalid. The user of the document must ensure that it is current before using it. This can be checked with the person responsible for the ISMS.
